又一次高兴地宣布, 我的 R 语言扩展包 ‘beginr’ (Zhao 2017a) 在 CRAN 正式发布了.
简介
beginr是我为 R 语言初学者和自己写的工具包, 是我这些年来收集和自己编写的一些简化操作的函数和备忘录, 可能对中级用户也有帮助. 其实这个包的文档我写得不够详细, 有些函数还没来及整理进去, 之所以匆匆发布, 是想先把 ‘beginr’ 这个名字给占住. 毕竟, 我中意的名字如 ‘learnr’, ’startr’都被别人用过了.
安装方法:
# 稳定版:
install.packages('beginr')
# 开发版:
devtools::install_github("pzhaonet/beginr")
下面分类介绍一下其中的函数.
备忘函数
我初学 R 的时候用 plot() 作图时, 常常忘记不同形状数据点(pch)对应的编号, 实线虚线(lty)的编号, 散点图类型(type)的代码, 以及最难选择的颜色代码. 每次忘了都要上网搜一下. 现在, beginr 里提供了 plotpch(), plotlty(), plottype(), plotcolors(), plotcolorbar()等函数, 想不起来的时候运行一下就行了.
beginr::plotpch()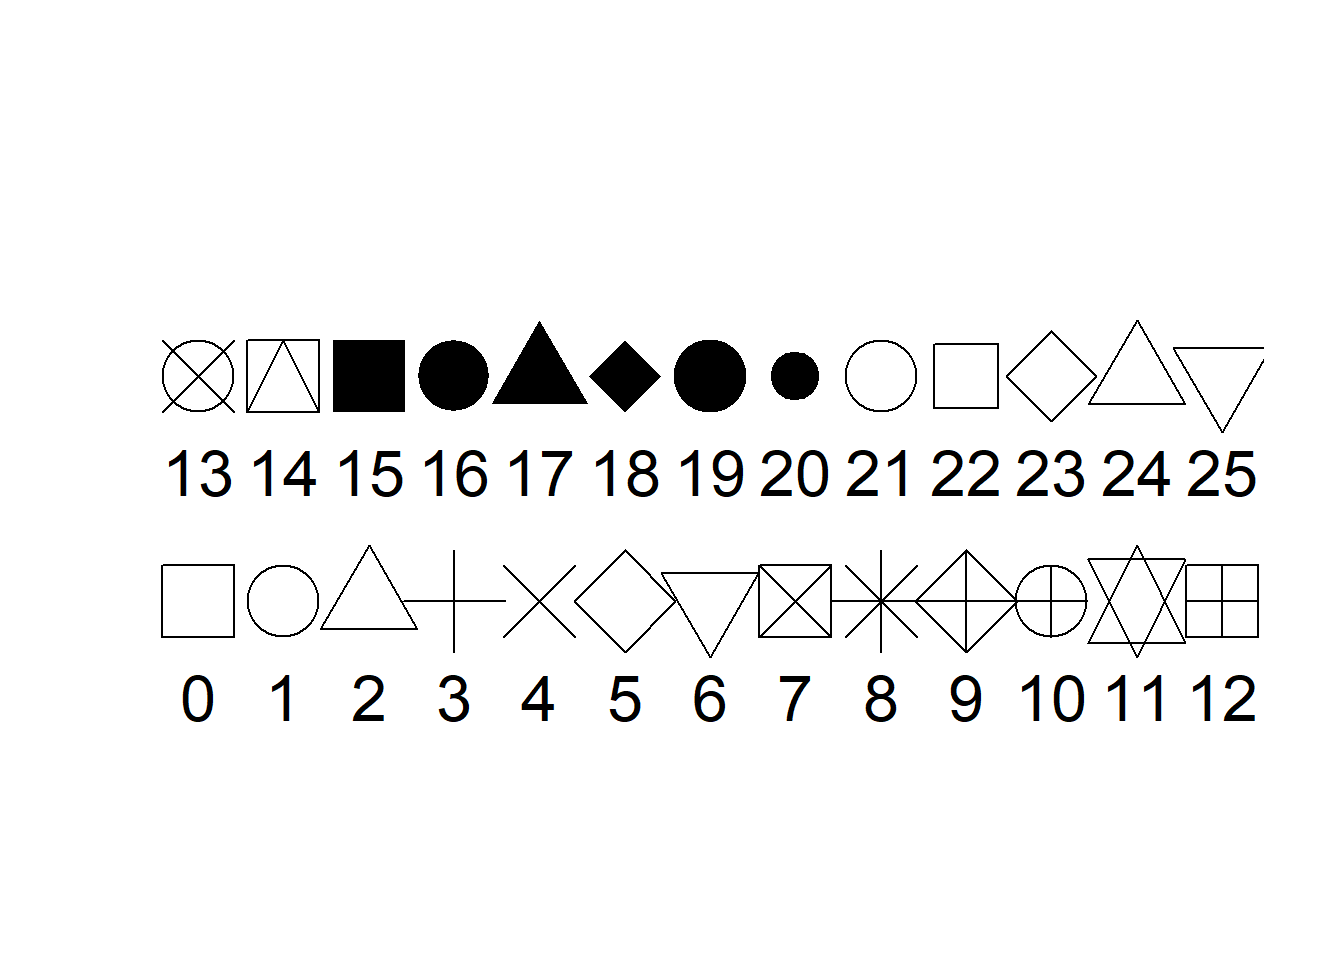
beginr::plotlty()
beginr::plottype()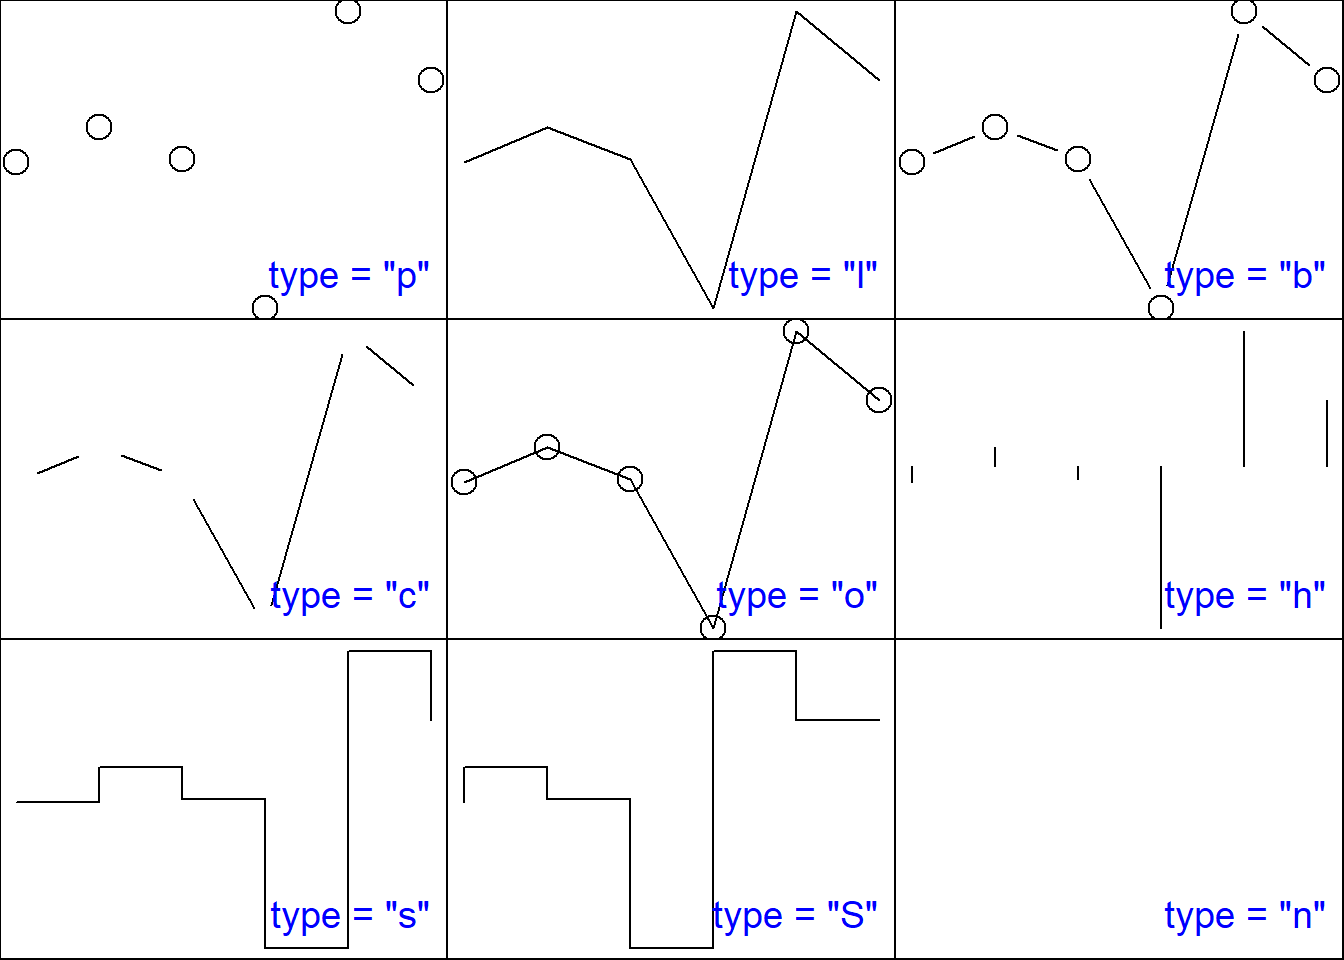
beginr::plotcolors()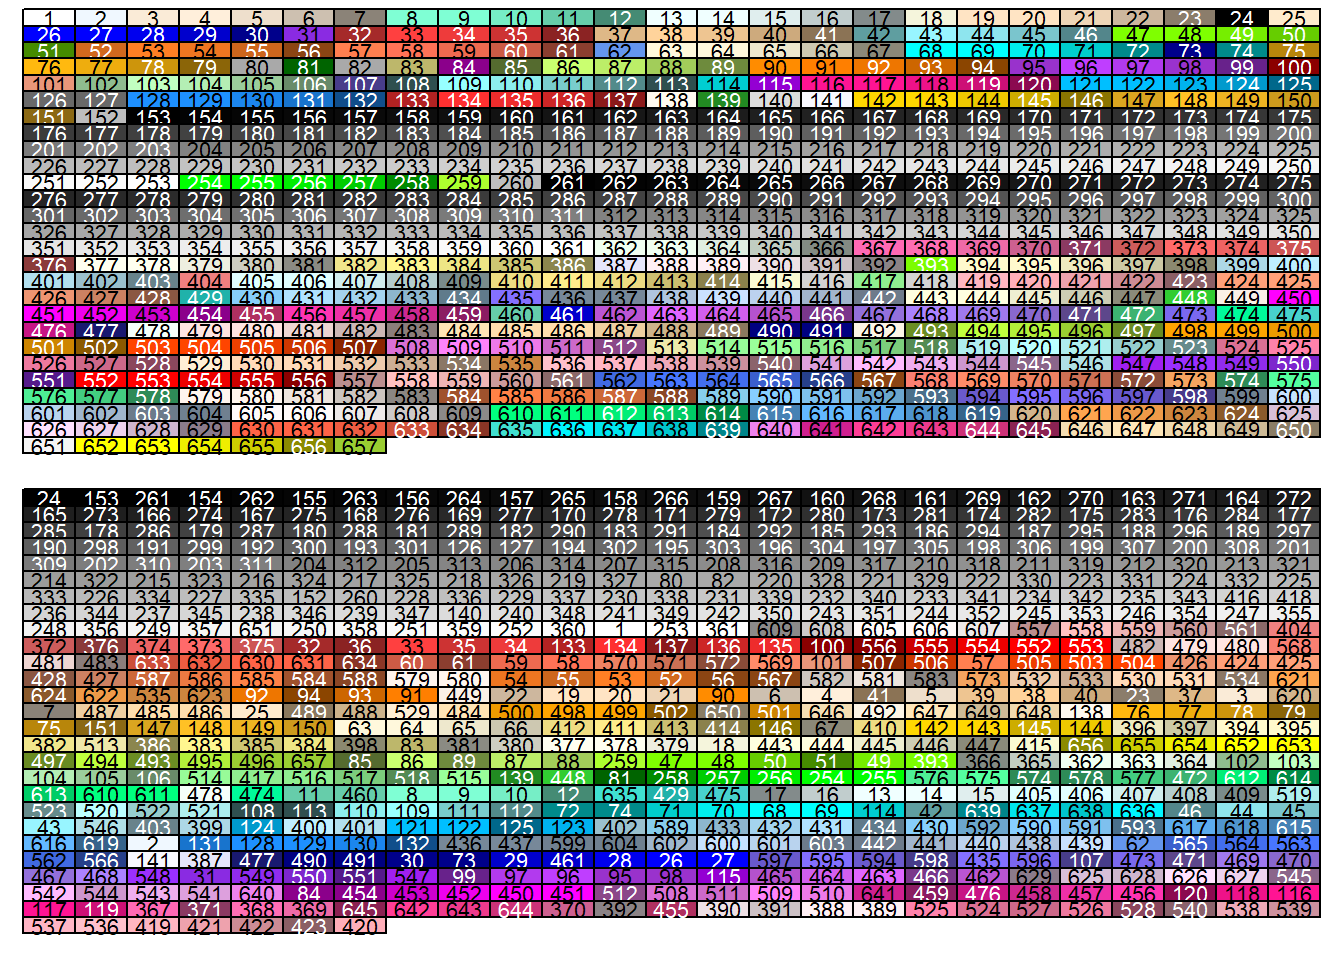
beginr::plotcolorbar()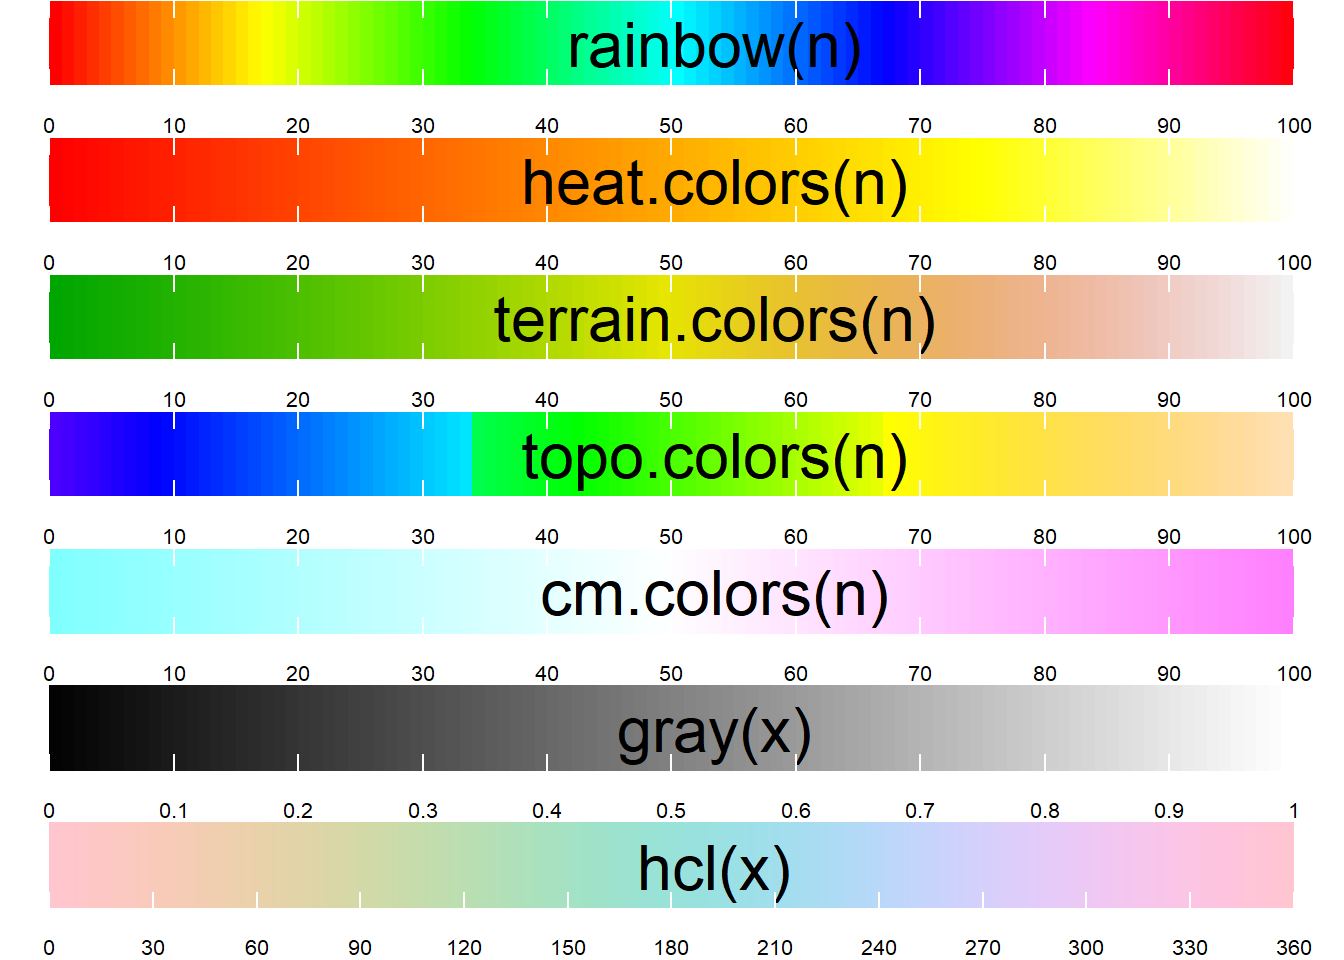
快速作图函数
我常常需要做线性拟合, 每次又是作图又是添加拟合方程, 繁琐. 现在, beginr 里的一个 plotlm()函数就搞定.
x <- 1:10
y <- 1:10 + rnorm(10)
beginr::plotlm(x, y)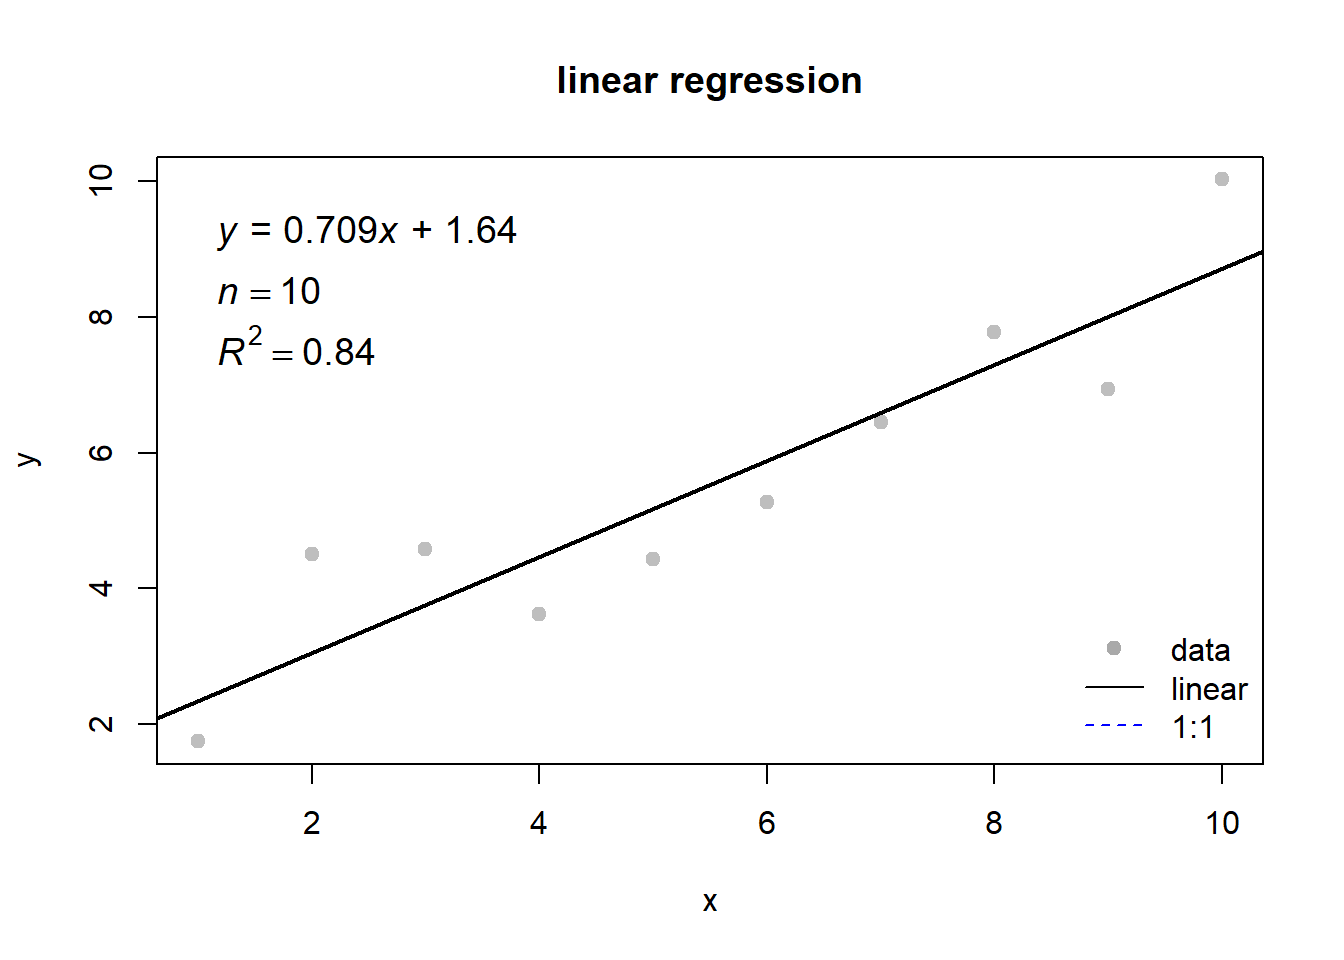
## [[1]]
##                Estimate Std. Error     t value     Pr(>|t|)
## (Intercept) -0.01008393 0.55084383 -0.01830633 9.858428e-01
## x            0.94114300 0.08877652 10.60126015 5.480082e-06
##
## [[2]]
## [1] 0.9335475
经常需要了解一组数据的分布, 看看是不是正态分布. beginr 里的 plothist() 函数不仅做出直方图和平滑曲线, 并且标出中值, 中位数, 四分位数, 标准偏差, 样本数, 以及用来判断是否正态分布的 skewness 值.
x <- rnorm(10000)
beginr::plothist(x)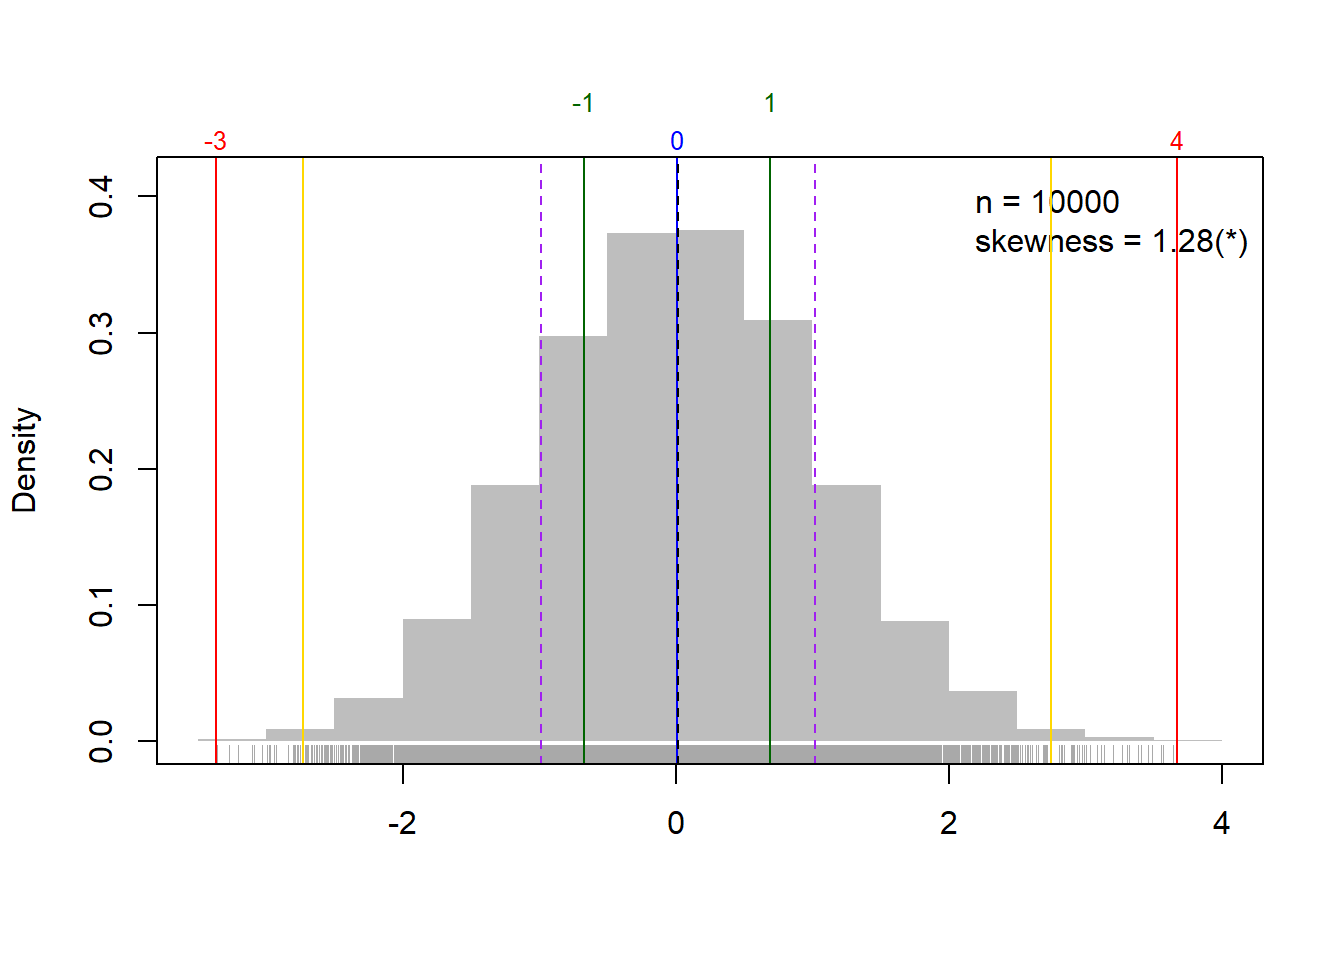
我很喜欢系统自带的成对儿散点图函数pairs(), 只是功能再强大一点就好了. beginr 里的 plotpairs() 和 plotpairs2() 可以实现.
df <- data.frame(a = 1:10, b = 1:10 + rnorm(10), c = 1:10 + rnorm(10))
beginr::plotpairs(df)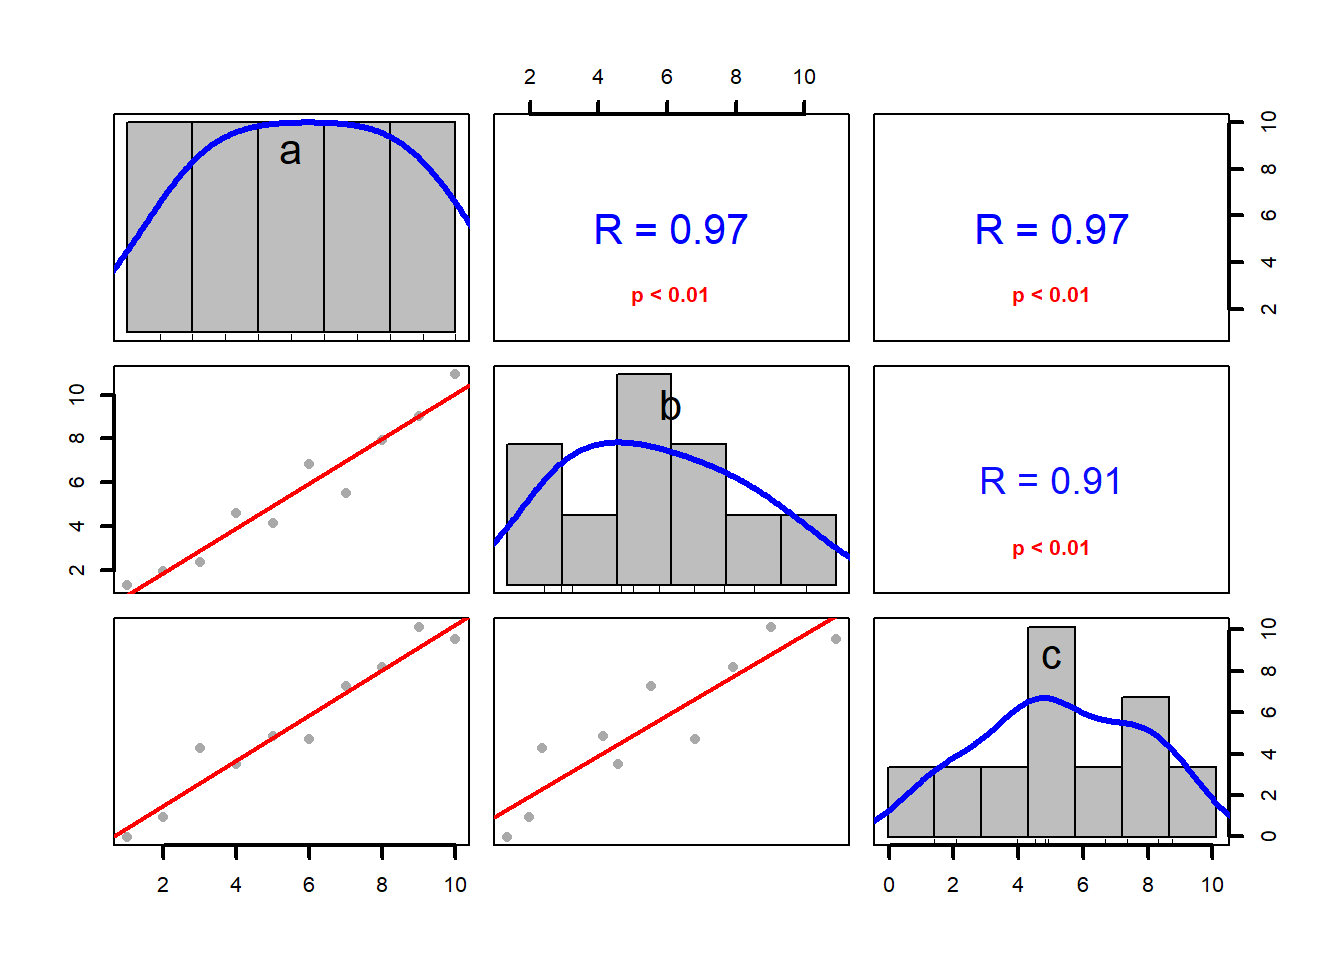
beginr::plotpairs2(df)## [1] "p<0.01"## [1] "p<0.01"## [1] "p<0.01"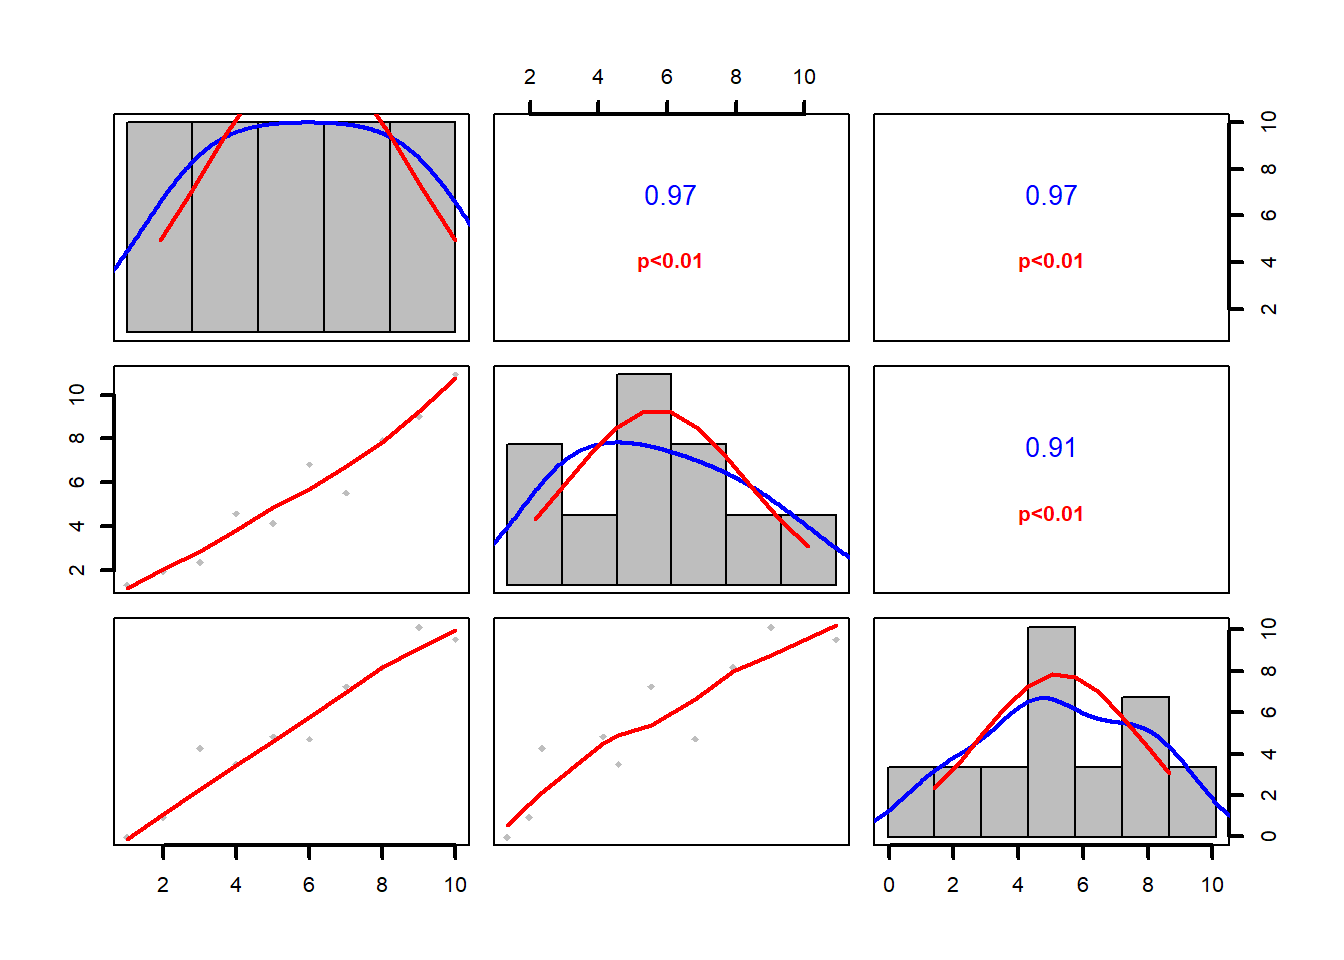
我经常需要将一组自变量 (x) 和多组因变量 (y1, y2, …, yn) 作在同一个坐标系, 或者一组因变量 (y) 对多组自变量 ((x1, x2, …, xn)), 并且画上各自的误差线. beginr 里一条 dfplot() 或 dfplot2() 函数就能完成.
x <- seq(0, 2 * pi, length.out = 100)
y <- data.frame(sin(x), cos(x))
yerror <- data.frame(abs(rnorm(100, sd = 0.3)), abs(rnorm(100, sd = 0.1)))
beginr::dfplot(x, y, yerror = yerror)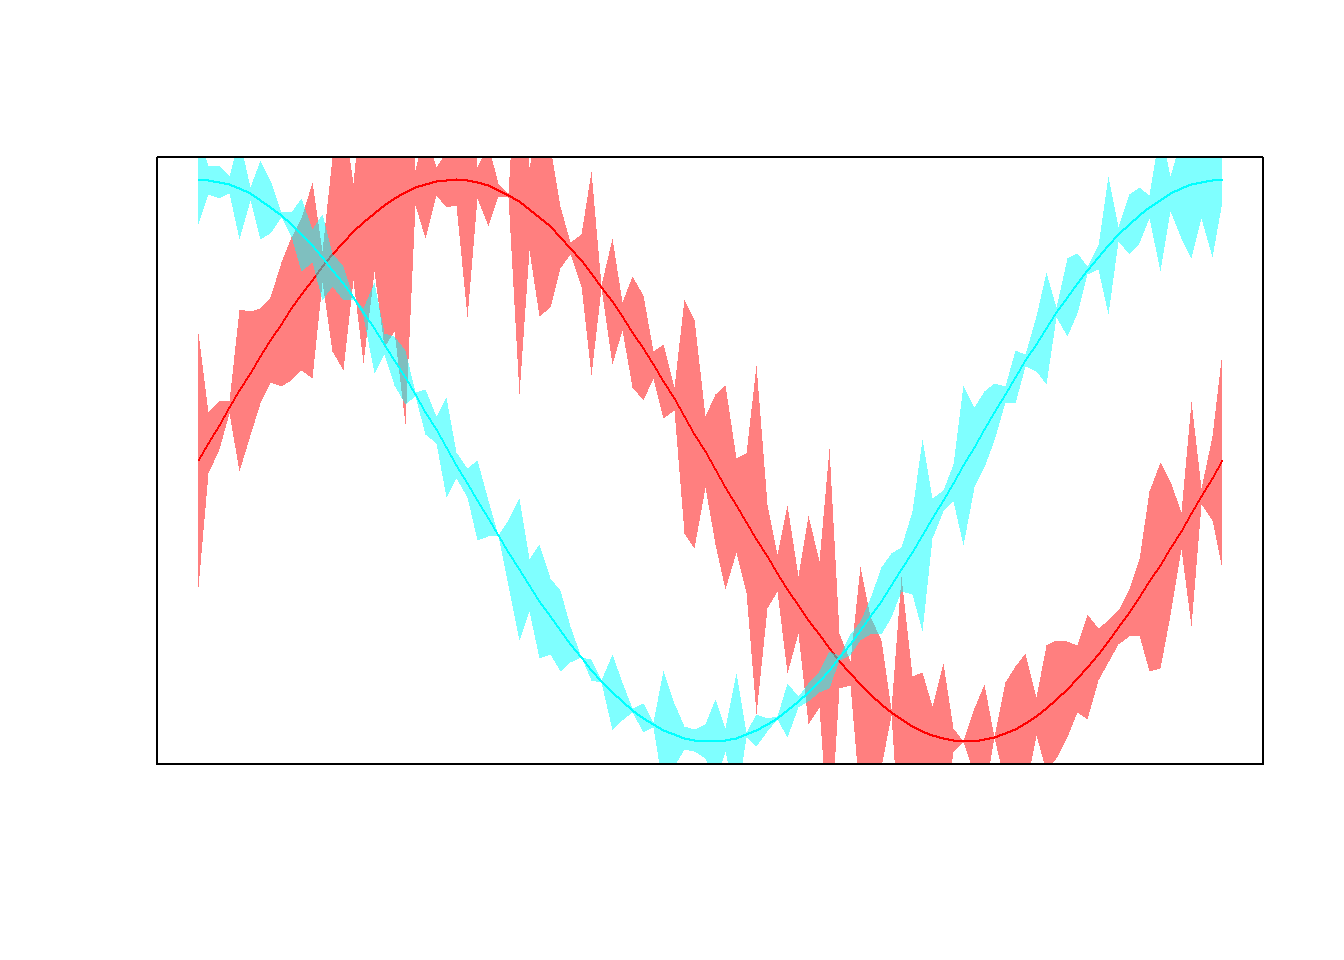
beginr::dfplot2(y, x, xerror = yerror)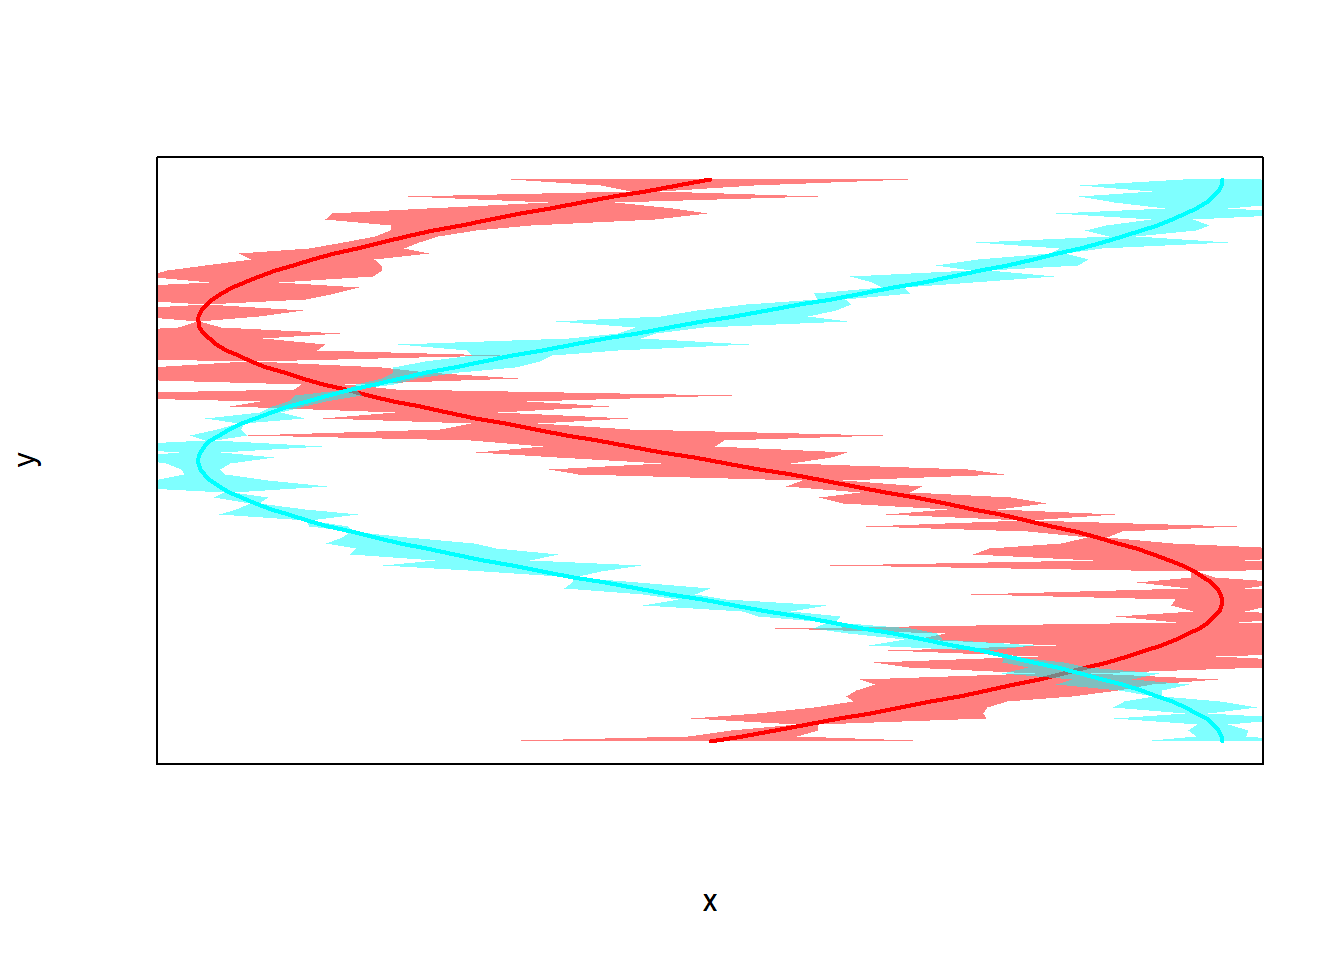
如果只是想简单添加误差线, 那就用 errorbar() 函数.
x <- seq(0, 2 * pi, length.out = 100)
y <- sin(x)
plot(x, y, type = "l")
beginr::errorbar(x, y, yupper = 0.1, ylower = 0.1)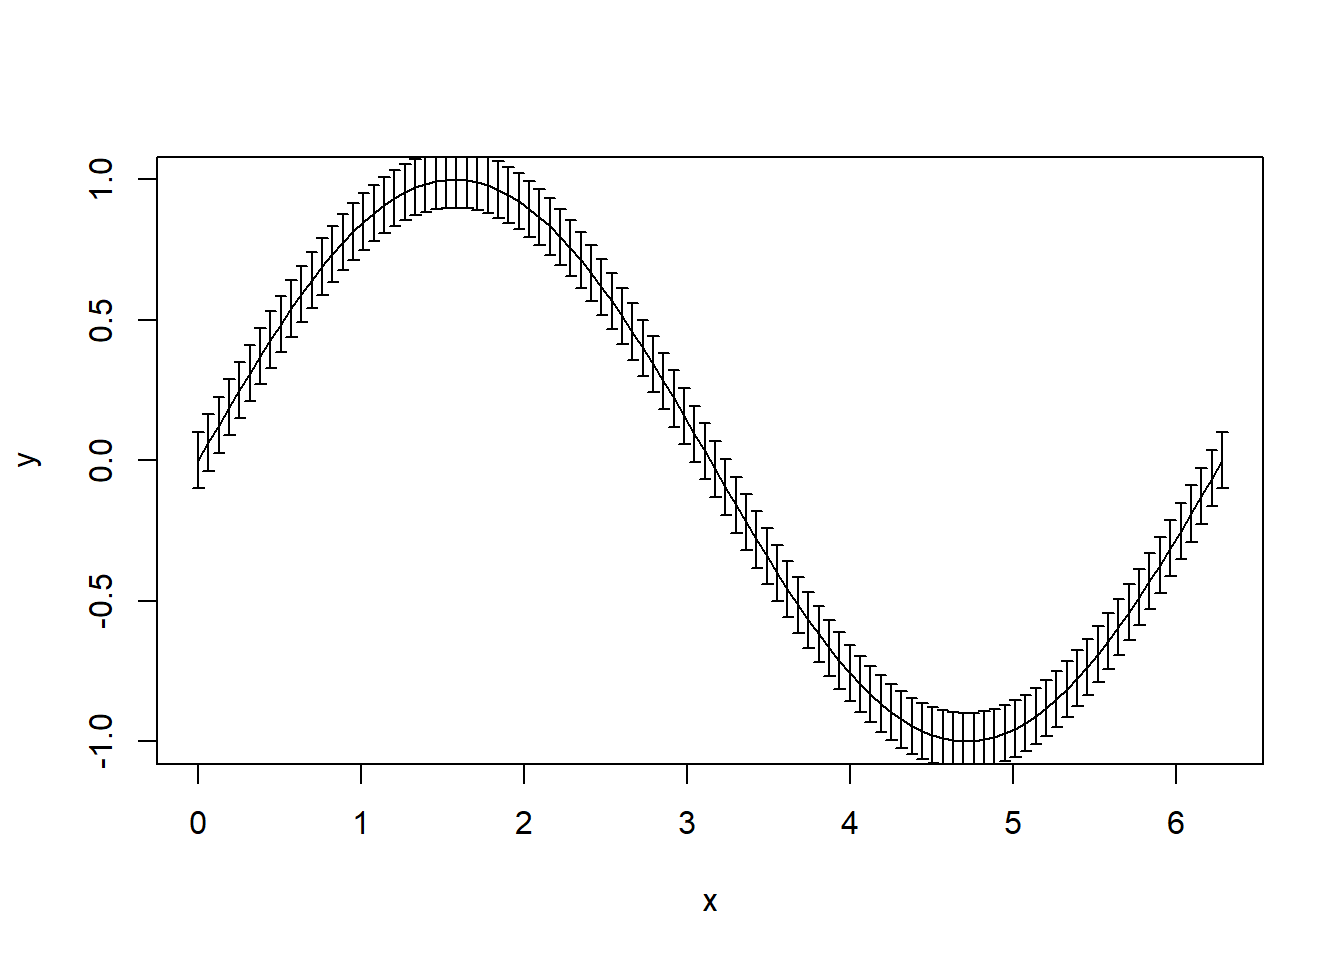
数据框操作
beginr 提供了一些对数据框计算的函数, 例如计算多列数据两两的相关性和线性拟合结果, 可以用 lmdf() 函数.
df <- data.frame(a = 1:10, b = 1:10 + rnorm(10), c = 1:10 + rnorm(10))
beginr::lmdf(df)
## x y r.squared adj.r.squared intercept slope Std.Error.intercept
## 1 a b 0.9889035 0.9875164 0.1904489 0.9363596 0.2175930
## 2 a c 0.8773598 0.8620298 0.2961183 1.0099714 0.8283655
## 3 b a 0.9889035 0.9875164 -0.1401049 1.0561151 0.2367744
## 4 b c 0.8738930 0.8581296 0.1340746 1.0704924 0.8606584
## 5 c a 0.8773598 0.8620298 0.4172838 0.8686977 0.7601762
## 6 c b 0.8738930 0.8581296 0.5640140 0.8163467 0.7258271
## Std.Error.slope t.intercept t.slope Pr.intercept Pr.slope
## 1 0.03506828 0.8752528 26.701038 0.4069459 4.164331e-09
## 2 0.13350318 0.3574731 7.565148 0.7299849 6.514664e-05
## 3 0.03955333 -0.5917233 26.701038 0.5703750 4.164331e-09
## 4 0.14377360 0.1557814 7.445682 0.8800645 7.294435e-05
## 5 0.11482891 0.5489303 7.565148 0.5980359 6.514664e-05
## 6 0.10964029 0.7770638 7.445682 0.4594793 7.294435e-05还有两个函数对tapply()进行了改善, 用来进行因子计算.
beginr::tapplydf()
beginr::tapplydfv()
文件读写函数
经常需要同时对多个数据文件进行处理, 逐个读入 R 里太麻烦. beginr 提供了个 readdir() 函数, 可以一次性把指定文件夹里所有数据读入, 保存在一个列表 (list) 里.
beginr::readdir()R 自带的 write 系列文件保存函数, 一不小心就把原有同名文件给覆盖了. beginr 提供了个安全的函数 writefile(), 避免一失足成千古恨.
beginr::writefile()list2ascii() 函数可以把一个列表原样保存成文本文件.
alist <- list(a = 1:10, b = letters)
beginr::list2ascii(alist)
扩展包函数
很多人引用了别人的工作却往往不列出参考文献. 不仅初学者常常如此, 很多学术论文里有些插图一眼就能看出是 R 的某个扩展包作出来的, 但参考文献里却没有列出来, 这往小了说是不尊重别人的工作,往大了说是缺乏学术道德. 对开源社区的生态圈是不利的. beginr 为初学者提供了 bib() 函数, 可以为指定的 R 扩展包生成文献引用信息, 既可以打印出结果, 也可以直接保存为 ‘.bib’文件方便为’bookdownplus‘(Zhao 2017b) 或’blogdown’ (Xie 2017) 调用.
beginr::bib(pkg = c("mindr", "bookdownplus", "pinyin"))## @Manual{R-bookdownplus,
## title = {bookdownplus: Generate Assorted Books and Documents with R 'bookdown' Package},
## author = {Peng Zhao},
## year = {2019},
## note = {R package version 1.5.5},
## url = {https://github.com/pzhaonet/bookdownplus},
## }
## @Manual{R-mindr,
## title = {mindr: Convert Files Between Markdown or Rmarkdown Files and Mindmaps},
## author = {Peng Zhao},
## year = {2019},
## note = {R package version 1.1.12},
## url = {https://github.com/pzhaonet/mindr},
## }
## @Manual{R-pinyin,
## title = {pinyin: Convert Chinese Characters into Pinyin, Sijiao, Wubi or Other
## Codes},
## author = {Peng Zhao},
## year = {2018},
## note = {R package version 1.1.5},
## url = {https://github.com/pzhaonet/pinyin},
## }plotpkg()函数可以做出一张图,来展示指定扩展包在CRAN上被用户下载的次数:
beginr::plotpkg("beginr", "2017-06-23")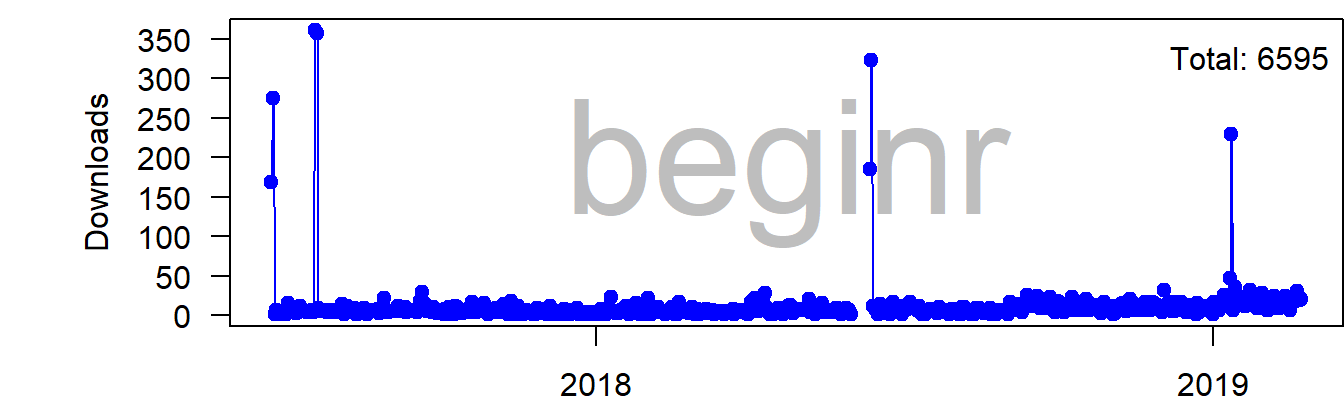
新手可以用rpkg()函数快速创建自己的扩展包.
beginr::rpkg()好啦, 以后我还会把更多有用的工具添加到 beginr 包里. 欢迎关注 beginr的项目主页. 另外, 使用beginr的地方请记得列出参考文献哦.
beginr::bib(pkg = c("beginr"))## @Manual{R-beginr,
## title = {beginr: Functions for R Beginners},
## author = {Peng Zhao},
## year = {2019},
## note = {R package version 0.1.4},
## url = {https://github.com/pzhaonet/beginr},
## }参考文献
Xie, Yihui. 2017. Blogdown: Create Blogs and Websites with R Markdown. https://github.com/rstudio/blogdown.
Zhao, Peng. 2017a. Beginr: Functions for R Beginners. https://github.com/pzhaonet/beginr.
———. 2017b. Bookdownplus: Generate Varied Books and Documents with R ’Bookdown’ Package. https://CRAN.R-project.org/package=bookdownplus.